
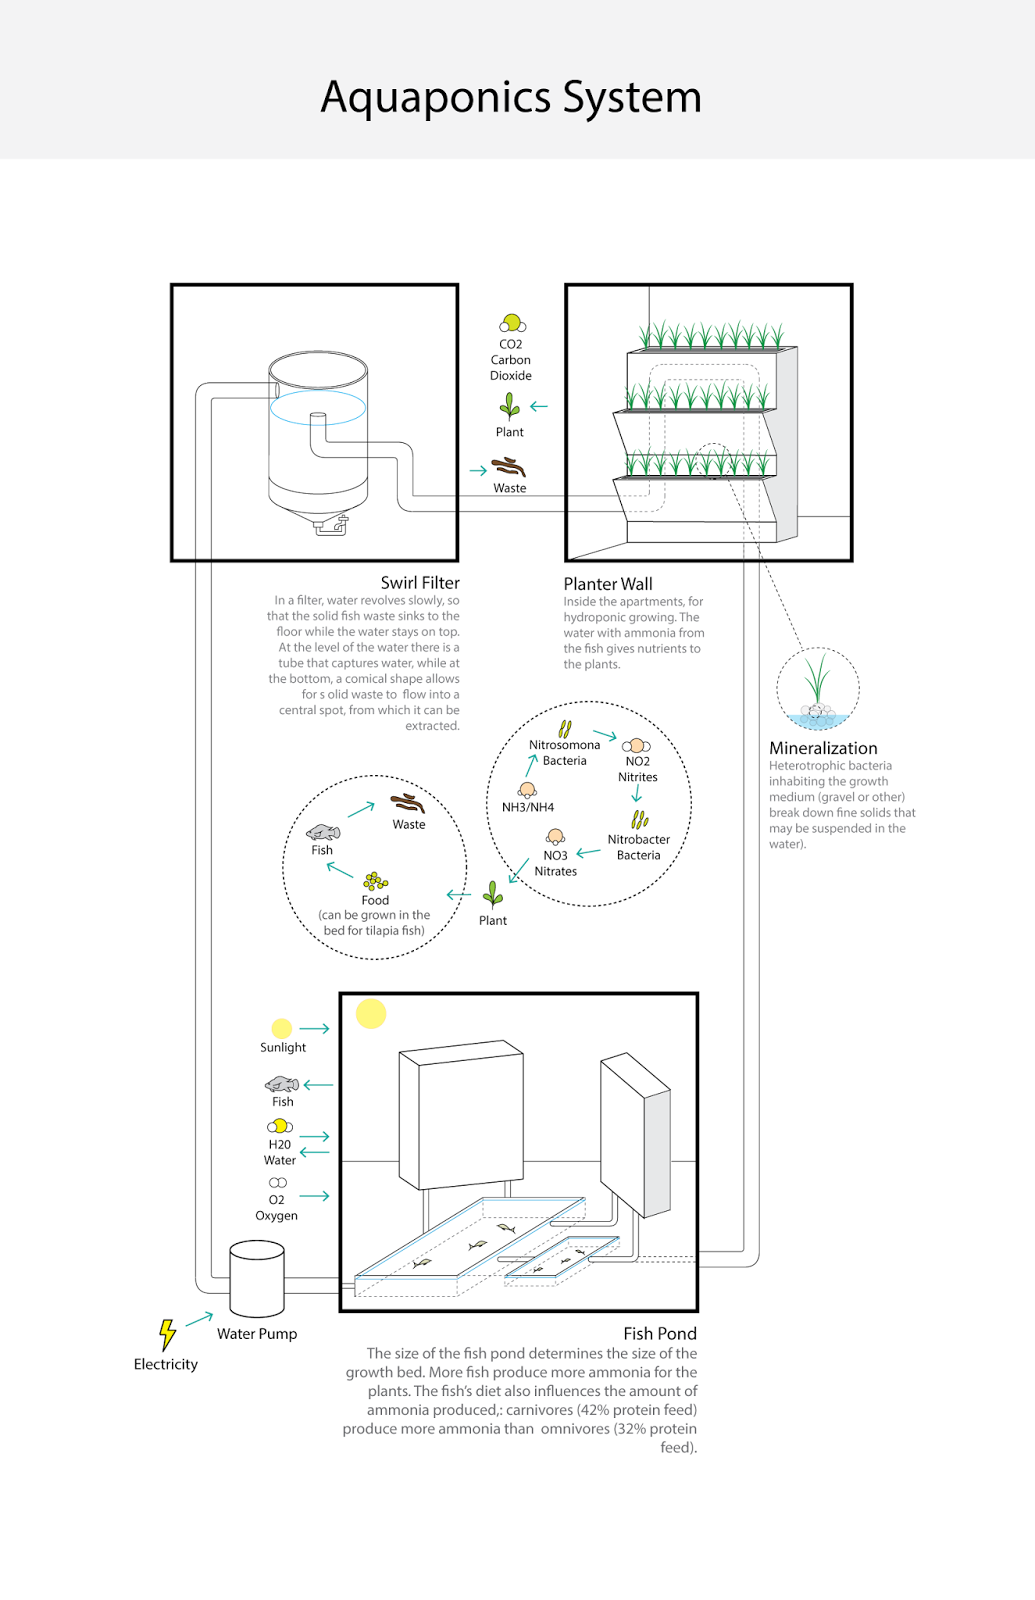
This chart shows the relationship between the size of a fish tank and the size of a grow bed that has been presented in the previous assignment's diagram. The two middle values, for 2000L, have a variation in fish density, which translates into a different grow bed size. I used two different charts, a circular chart and a bar chart in conjunction to demonstrate the relationship between the two stages of the aquaponics cycle.


